The tests below are not meant to be precise, but rather to show that libfluid performs slightly better or at least as well as existing OpenFlow controllers in extremely simple (and probably unfair) scenarios.
We benchmarked some existing controllers and two variations of example libfluid controllers:
The benchmarks were performed on a desktop equipped with an Intel Core i7-2600 CPU (4 cores, 8 threads @ 3.4 GHz) with 8 GB of RAM (@1333 MHz) running Ubuntu 12.04.2 and its standard software stack. TCMalloc was used for better performance in C/C++, and recommended benchmarking guidelines were used when available. OpenJDK 7 64-bit provides the JDK/JRE for the Java controllers.
cbench is used to take the measurements.
Description: This test shows a raw measurement of the throughput in different controllers and compares them to libfluid. These values show just part of the picture, since there are differences in the implementation of the learning switch in different controllers.
Switches: 16
Controllers: Beacon, NOX MT, Floodlight, raw, msg
Threads: 8
Application: learning switch
Command: cbench -c localhost -p 6653 -m 10000 -l 16 -s 16 -M 1000000 -t
Results (higher is better):
| Controller | flows/ms |
|---|---|
| raw | 7929.39 |
| Beacon | 7682.54 |
| msg | 5013.35 |
| Floodlight | 2490.61 |
| NOX MT | 2310.17 |
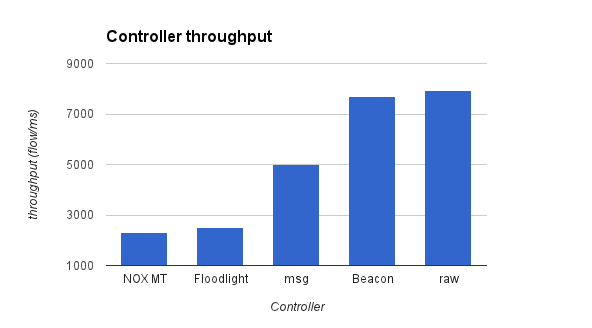
Comments: the msg controller doesn't perform as well as the raw controller due to C++ object creation. The performance gap could be practically eliminated by using an object pool. Java doesn't seem to be affected by this problem as much, helping Beacon's great numbers.
Description: This test shows a comparison of the latencies introduced by different controllers running a learning switch application and compares them to libfluid. These values show just part of the picture, since there are differences in the implementation of the learning switch in different controllers.
Switches: 16
Controllers: Beacon, NOX MT, Floodlight, raw, msg
Threads: 8
Application: learning switch
Command: cbench -c localhost -p 6653 -m 10000 -l 16 -s 16 -M 1000000
Results (lower is better):
| Controller | ms |
|---|---|
| Floodlight | 0.005233 |
| msg | 0.005213 |
| raw | 0.005178 |
| Beacon | 0.004978 |
| NOX MT | 0.004576 |
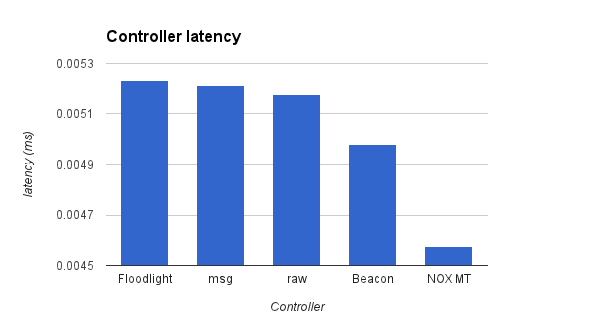
Comments: we didn't optimize libfluid for latency at any time during development. It may be possible to improve these numbers.
Tests 3 and 4 only measure libfluid_base (using the raw controller).
Description: This test made to see how libfluid performance varies depending on the number of threads. In this test we use a different application, which simply replies to cbench's packet in events with dummy flow mods, so we can test how libfluid_base performs when tuning the number of threads used. We will call this application "cbench fast reply".
Switches: 16
Controllers: raw
Threads: 1, 2, 4, 6, 8, 16
Application: cbench fast reply application (see description)
Command: cbench -c localhost -p 6653 -m 10000 -l 16 -s 16 -M 1000000 -t
Results (higher is better):
| Threads | flows/ms |
|---|---|
| 1 | 2781.02 |
| 2 | 5411.45 |
| 4 | 8777.26 |
| 8 | 8599.53 |
| 16 | 6937.99 |
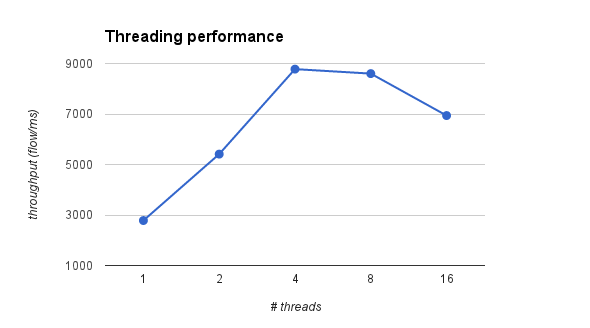
Comments: due to the simple nature of the cbench fast reply application, its performance is better with 4 threads. The learning switch in all the other controllers runs faster with 8 threads.
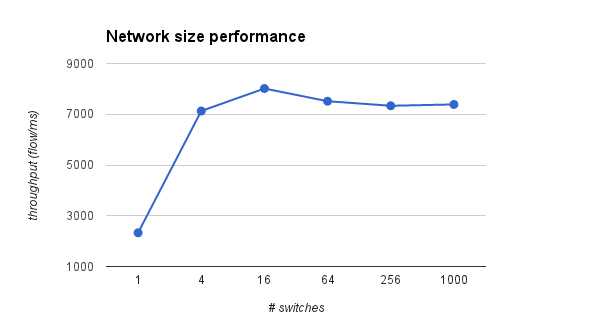
Description: This test shows how libfluid_base performance scales when increasing the network size. The number of MACs per switch was reduced (from 1000k to 100k) to avoid thrashing.
Switches: 1, 4, 16, 64, 256, 1000 (~2^2n, n = 0..5)
Controllers: raw
Threads: 8
Application: learning switch
Command: cbench -c localhost -p 6653 -m 10000 -l 16 -s 16 -M 100000 -t
Results (higher is better):
| Switches | flows/ms |
|---|---|
| 1 | 2327.88 |
| 4 | 7128.02 |
| 16 | 8013.98 |
| 64 | 7513.87 |
| 256 | 7334.20 |
| 1000 | 7386.28 |
Beacon
Download the binary. See the instructions.
NOX MT
Download from GitHub repo.
Build with ../configure --enable-ndebug and run with:
Floodlight
Download the sources.
See the instructions.
Put the following line in /src/main/resources/floodlightdefault.properties:
And then build and run:
raw
Build with -ltcmalloc -O3
Run with: ./raw_controller [app]
msg
Build with -ltcmalloc -O3
Run with: ./msg_controller [app]
Test 1
Test 2
Test 3
Test 4